
Reflections on a PoC approach: Ofsted Scrape
- Jul 4, 2025
- 12 min read
Updated: Jul 7, 2025
At Data to Insight (Home | Data to Insight) we solve data related problems, but sometimes that might start with looking at a picture where there is no clear data problem, just data.
Part of the excitement of Data to Insight (D2I)... is the capacity to find out whether we (as a sector) can get some way to solving something that might add value or enable local authority teams; primarily in data and processes that impact Children's Services. Sometimes given the scale of the Local Authority/Children's Services picture, 'solving' in this context might be limited to just adding a useful additional cog to a much larger system, where you're not even sure what the next adjoined cog is going to look like. With the Ofsted Scrape Tool, that's pretty much where we found ourselves; and I thought it might be of interest to reflect on and share a proof of concept(PoC) process, especially since LIIA (LIIA – London Innovation and Improvement Alliance) have recently, added a much more exciting adjoining cog.
Every local authority waits patiently (and in truth somewhat nervously) for their own full Ofsted inspection details, the good, the bad and the ugly... it's all in there, alongside the core headlining results set against standardised themes.
Overall Effectiveness Grade
Help And Protection Grade
In Care Grade
Care Leavers Grade
Waiting, equally patiently... are the other 152 local authorities…. You know what it's like, it's always interesting to know how your neighbours are performing. Which is why, having periodically checked the Ofsted site (Find an Ofsted inspection report) for a week, until the report was published, LA colleagues would then be awaiting the next published summary update by Ofsted or the ADCS. That summary being more useful in the wider context in data terms, because it comes already as an Excel summary, with everyone's most recent report results, the LA names and region code etc… much more value for looking at the bigger picture.
Let's be clear about why the collective value of these reports is important (because it's certainly more than just surface-level LA neighbour envy). Each local authority's Children's Services attempts to make the most of the limited resources they have to enable the best outcomes for those they aim to provide positive outcome(s) for. If they can understand how others are doing, interpret best practice from either end of the overall judgement results scale (Unsatisfactory -> Outstanding) and potentially combine data to gain further insight(s), we can start to build a story around how we consider that improving access to this data model might add real value to the sector, and help define an initial problem brief.
Key issues | rough starting point for the problem brief
Individual LA's, having to check the Ofsted site for newly published inspection reports
Unless you know who was last|recently inspected, you'd have to check every LA's subsection on the Ofsted pages for updates
Manually searches or page by page to find relevant LA report(s) via the Ofsted site can be clunky
Published inspection reports are pdf format. Requiring copy|paste of data into usable, usually Excel, format
The only existing summarised Excel version available via Ofsted|ADCS is out of date potentially within one day
Potentially, each LA is doing the same manual checking, and manual data adding for their own related data analysis.
Which conceptually at least, brings us to a problem brief along the lines of:
" Ofsted inspection results data is restricted by the frequency that Ofsted|ADCS summary is (re-)published. Given that individual Ofsted inspection reports are published often (but with irregular publishing pattern), could we access the data/results directly ourselves and re-create an on-demand summary. Concurrently, are there any other data points that we could combine with to increase the potential use-cases
It's at this point, where I'm jumping back to June 2023, that I wish I'd have kept better ongoing thought-process notes during development. This is something, alongside some wider thinking around both meta data and D2I documentation, that I'm hoping to return to in the near future. Definitely a point of personal reflection as I attempt to retrieve my process-thinking and some of the nuanced data issues encountered as part of the development. However, the development progressed more as step by step proof of concept rather than a mapped out design. This perhaps befitting of Gall's Law (John Gall - Wikipedia) and the "argument in favour of under specification", but certainly a case of learning by doing.
How's the source data looking?
As we progressed into exploratory source data handling, the more granular issues from a data munging/pipeline perspective started to become clearer. Some were predictable e.g., inspection reports have inconsistent judgement types, due to official changes from Jan2023 where the framework for inspections changed; others more unexpected resulting from inconsistencies/nuanced content. Inspection dates for example; on the surface a minor data point and yet one of the more problematic elements due to the scale of inconsistencies, not made any easier by the fact that we're having to apply an informed but trial and error approach to reliably locating this within the relevant page/document.
Inspection dates
Inspection dates were inconsistent across PDF reports. These dates defined the day the inspectors arrived, and how long, or separate days that they visited during each inspection.
Data observed examples | Notes |
15 to 26 November | Single month, no year, date range |
8 July 2019 to 12 July 2019 | Full dates with years on both sides |
28 February to 4 March | Spanning two months |
8 October to 19 October | Same month, both dates listed. |
['8 July ', '12 July and 7 August to'] | Tokenised or malformed lists from PDF extraction |
11 September 2017 to 5 October 2017 | Two full dates across months with years |
Dates - data munging approach
Data observed / Issue | Approach taken |
Inconsistent formats like '8 July to 12 July 2019' or '19 November–30 November 2018' | Standardised dashes, replaced inconsistent delimiters, and injected the shared year into both start and end dates |
Missing year in start date (e.g. '15 to 26 November') | Extracted year from full string and propagated it to the incomplete start date |
Split digits in date text (e.g. '1 9 June 2019') or other encoding artefacts | Collapsed split digits and replaced hidden characters like non-breaking spaces |
Some reports include multiple inspection periods joined with 'and' | Parsed only the first valid inspection range to avoid misalignment in results |
Start date often lacks month while end date includes it (e.g. '15 to 26 November') | Borrowed the month from the end date to complete the start date before parsing |
PDFs included hidden characters like \u00A0 (non-breaking space) that interfered with matching | Replaced special characters before applying any date parsing or cleaning logic |
Start date occurs after end date due to extraction error | Inserted safeguard to detect reversed order and flag invalid cases |
End date missing due to formatting inconsistencies | Set output as 'invalid date format' where parsing was not possible |
Framework classification needed based on duration | Used date difference in days to assign 'short', 'standard', or 'longer than standard' inspection |
Output dates needed consistent DD/MM/YYYY format | Converted parsed date objects to standardised output format using formatter function |
Judgement schema changed post-Jan 2023 (e.g. 'care_leavers') | Suppressed or replaced fields for inspections dated before schema change |
Being able to extract the inspection report dates underpinned more than just our ability to publish the date range in the summary; they also determined our ability to define whether an inspection was a short or standard ILACS inspection based on the duration.
Judgement grades / inspection results
Inspectors assign one of a range of four possible judgement grades within four core themes (Overall Effectiveness, Help And Protection, In Care, Care Leavers). Unfortunately, identifying these within the results table, also turned out to be less than trivial.
Grades - data munging approach
Data observed / Issue | Approach taken |
Grades with appended commentary or variations (e.g. 'Requires improvement to become good') | Stripped commentary and normalised phrasing to base judgement like 'requires improvement' |
Grades appeared in multiple locations within PDF (summary and sub-sections) | Prioritised summary-level 'Overall effectiveness' grade and mapped others by known judgement order |
Split or encoded words from PDFs (e.g. 'Req uires im provement') | Rejoined fragments using regex cleanup and whitespace removal |
Judgement table headers malformed or embedded mid-table | Searched rows for expected header terms and rebuilt DataFrame if structure was detected |
Results table position varies by report (sometimes not on page 1) | Used fallback logic to locate or reconstruct judgement table, or inserted placeholder if unreadable |
Grades and judgements misaligned due to multi-line entries | Flattened entries, reassigned values based on known order, and rebuilt clean judgement table |
String values like 'nan', blanks or missing values in grade column | Standardised missing data as NaN or placeholder 'data_unreadable' |
Some local authorities produced malformed reports consistently | Applied manual patches or structure overrides for specific authorities |
'Care leavers' judgement only valid post-Jan 2023 | Suppressed 'care_leavers' for pre-2023 inspections and replaced with appropriate fallback |
Variants like 'be good', 'is good', or 'RI to be good' | Mapped to canonical values such as 'requires improvement' using regex |
Mixed case and spacing in headers and content (e.g. ' Grade \n') | Normalised case, removed newlines, trimmed whitespace and punctuation |
Ofsted inspector names
This data point was non-critical in terms of MVP 'useful' data points, but perhaps useful if we're looking for patterns in the data. Inspector name extraction was particularly fragile.
Data observed / Issue | Approach taken |
Inspector names prefixed by labels (e.g. 'Lead inspector: Jane Smith') | Used pattern matching to detect and isolate named roles like 'Lead inspector', 'Inspector', or 'Team inspectors' |
Inspectors listed as 'John Doe, HMI' or prefixed with 'Ofsted Inspector' | Stripped suffixes like 'HMI' and removed organisational prefixes for name normalisation |
Multiple names listed (e.g. 'Alice Brown, Bob White' or 'John Doe and Jane Roe') | Split composite entries using commas, 'and', and line breaks to extract individual names |
Labels missing or ambiguous (e.g. just names without 'Lead inspector' tag) | Fallback matching used to extract names from nearby patterns or positional logic |
Inconsistent title placement (e.g. 'Ofsted Inspector John Smith', 'Jane Smith HMI') | Cleaned and repositioned extracted name components to remove role/affiliation noise |
Some PDFs omitted inspector names entirely | Returned `None` or placeholder when no inspector name could be identified |
Reflecting back on the development definitely brings some amusement; in fact there was so much more that required 'handling' than was expected, some of which remains on the backlog. But some examples that come to mind are:
Authorities with problem | unexpected encoded PDFs (e.g., Knowsley, Stoke).
PDF encoding – methods used to encode report pdfs appear to have changed over time, so extracting data from them sometimes requiring recognising this, and applying more than one approach
The LA names in the Ofsted reports often don't tie in with what we have elsewhere, only an issue if we want to find a common key.... which we do (more so as the existing ADCS version omits this)
There's different types of inspections, and associated reports for each local authority and we're not interested in all of them – so how do we identify, and only scrape the relevant ones.
Inspection results within the report document(s) are text based rather than (cleaner) numeric scale
Inspection results are commonly presented in a table, usually (but not always) on the same page within the PDF report .
Some elements within the reports, like the judgement results wording, should be standard, e.g. 'Requires improvement' … but are not!
(Automated)Processes that are developed as a retro-fit to existing data are always an eye-opener, much in the same way as anyone who's ever tried to represent mainly text or date based input data into a visual format. When you (as the developer), get reminded of the scale of nuance/differences that can occur and at times only really becomes clear when you ask a computer/programming language to read or handle it. You'd also hope that no PDF was ever meant as the ideal source input into automation!).
When we're looking to obtain or 'scrape' openly available data, an important step is to take some time to understand where and how the source data is located and structured, and what the available format(s) might be. We're looking at some common scenarios, the most ideal of which would be an agreed API interface that is already designed for us to interface with and with data that is usually already prepared. However, within our sector, those are few and far between... but worth checking! Instead, we start to build a picture of what our tool is needing to traverse in order to hopefully access the needed data. Often, this is an area that from a human perspective we under-estimate as we can interpret and easily separate the irrelevant on a page of interest, going straight to what we need. We can see past typos, inconsistencies in date formats, a slightly different file location on a page and any differences in the underlying page meta structures. Our automated workflow has to be told explicitly what to do for every known eventuality, and also handle the unknown. At least some of the unknowns, I think at D2I, given the rate of sector changes and disparate systems, we probably do implement somewhat aligned with Donald Knuth (Donald Knuth - Wikipedia) on planning for change rather than perfection.
As such, we did include (some)fault-tolerance, so it won’t break (as)easily if the site is slow or temporarily unavailable. It includes retry logic for common request failures like timeouts or connection issues, and it uses exponential backoff with a bit of randomness to avoid overloading the server or unnecessarily triggering bot detection. Error handling also wraps each request, so if something fails, the script can pause and try again instead of crashing. The scraper walks through each provider’s page, pulls out the URN, and looks for the latest inspection report using patterns in the HTML. For efficiency, I avoided traditional pagination and instead use a direct search URL that returns all results in one go. This actually cuts down the number of HTTP requests, speeds up execution, and simplifies some of the logic – much less overhead than clicking through page by page (but.... is arguably more impacted by site structure changes). I think that it's also worth mentioning here, we schedule the scrape so that it's out of hours to minimise impact both on the Ofsted server, and other users. This aligns with common web scraping principles — avoiding unnecessary load, spacing requests, and being respectful of shared public infrastructure.
Data enrichment
From the start, we knew that being able to summarise the published data would be a useful* step in isolation, but that being able combine or enrich it with some additional attributes, incl. a more reliable 'key' identifier as a minimum would be an enabler for others – aligning with the D2I mantra of "develop once, use 153 times" (there being 153 local authorities in England).
In the Ofsted data, the only existing key was a less-than-ideal 'local authority name' text string, however the naming style and format varies across systems, both public and internal (including D2I's own!). The ONS/Gov do standardise this, but the onward, existing systems don't always stick to this and we're working as best we can to those. *Knowing what truly useful was in this context remained slightly tricky as we also couldn't predict onward use-cases; likewise, examples or specific details of what others were currently doing with this data weren't readily available.
Local Authority name inconsistencies
The LA name is critical, as it's our only available 'key' field in the source Ofsted data. Some examples of the data handling needed:
Example / Issue | Approach taken |
City of London Corporation | Long, formal name was normalised to 'City of London' for consistent downstream usage |
London, City of | Inverted order and ambiguous form was remapped to 'City of London' |
Derbyshire County Council vs Derbyshire | Removed suffixes like 'County Council' to retain standardised name |
Brighton and Hove City Council vs Brighton & Hove | Ampersand variation resolved by mapping to canonical form with '&' |
Blackpool Borough Council | 'Borough' inconsistently used, replaced with standard unitary name |
Camden, Camden Council, London Borough of Camden | Multiple prefixes removed, all reduced to base borough name (e.g. Camden) |
Kingston upon Hull City Council vs Hull vs Kingston upon Hull | Mapped to 'Kingston Upon Hull' and applied similar treatment to other affected LAs (e.g. Newcastle, Richmond) |
Southend-On-Sea, Stockton, Stoke | Retained hyphens for known subset of LA names where official style includes them |
We also had some decisions to make as to how/whether to include depreciated local authorities e.g. Cumbria becoming part of Westmoreland and Furness to assist how colleagues might be using both during data transition(s).
Scheduled Ofsted results summary
Where did it end up? Well, we were able to publish a functional tool that addressed ~99% of the initial core problem brief. The remaining being some problematic individual data points for a handful of local authorities. But 150+ local authorities now have access to an open source, automated, weekly scheduled summary of all published inspection reports results within England via a simple published web summary: Ref: data-to-insight.github.io/ofsted-ilacs-scrape-tool
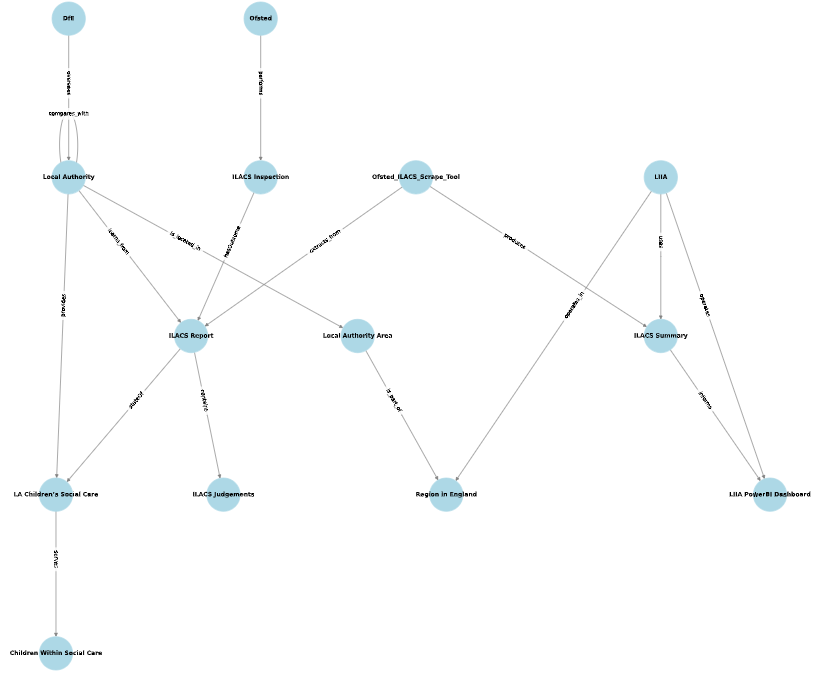
Smart City Concept Model (SCCM)
As we develop our understanding and look to align our thinking and meta definitions of our tools with the Smart City Concept Model (SCCM) BSI framework, the Ofsted Scrape Tool might be represented diagrammatically as:
Sinkhole or shelf ware?
It's always exciting when someone else also sees the potential, steps in, and brings their own time and skills to it. This is where the London Innovation Alliance (LIIA) come in.
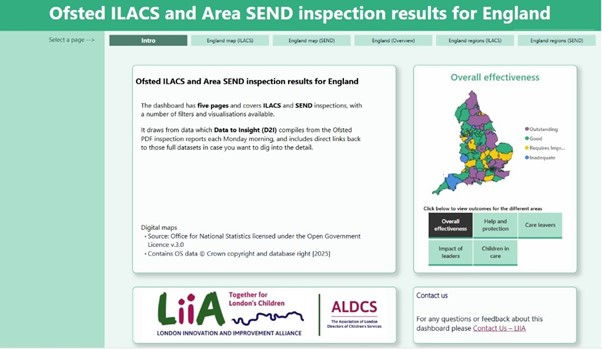
It started with some feedback conversations and interest around the scraped results shown on our web summary page, but turned into a fully formed dashboard (PowerBI). Initially this was London-centric but has now with further development from LIIA, morphed into an exciting and national dashboard used by colleagues everywhere and fed with the data generated via the D2I tool.
Ref: Microsoft Power BI (Link access might be restricted, screenshots below)

Related work
The learning has also since underpinned work on other tools
And work in progress on such as :
HMI Probation Youth Justice Inspections (Pre-Release) - data-to-insight.github.io/hmi-youth-justice-scrape
*My colleague Alistair Herbert also brought me in contact with Richard Tyndall's great work as part of the South East Sector Led Improvement Plan (SESLIP) and his Ofsted Visit Analysis – SESLIP . This work includes insights into the time period between inspection and the finalised report being published.
Python tools used
In case useful for those looking to harness Python to achieve something similar, here's a partial view of the key Py tools applied.
Scraping and web requests
requests | Fetching PDFs and web content |
requests.exceptions | Error handling for HTTP request failures |
BeautifulSoup | Web scraping and HTML parsing |
random | Jitter retry delays, incl. exponential backoff |
PDF handling
PyPDF2 | Text extraction from PDFs (now depreciated, use pypdf) |
tabula | PDF Table extraction (Java based) |
io | Handling PDF buffers in memory |
Data handling and cleaning
pandas | Tabular data manipulation and Df operations |
numpy | Handling nulls and placeholder values |
re | Pattern matching and string cleaning |
Date and time
datetime | Parsing, formatting, and comparison |
timedelta | Calculating differences between dates |
System and filesystem
os | Filesystem access, environment path detection, GitHub Actions compatibility |
xlsxwriter | Excel file output |
Comments